


.avif)

%20(1).png)


.png)
.png)


.jpg)
March 17, 2023
Tips n’ tricks for using Power BI Natural Language Processing (NLP)
So you want to leverage the value of your data? It can be as easy as searching a question in plain language, thanks to Power BI Q&A, or exploring new insights with smart narrative reports made from your visual data. It’s all part of one powerful feature, Natural Language Processing. While it’s available to all users, there are some tips for getting the most out of it.
Here are a few to take note of:
Tip one: teach, suggest, review
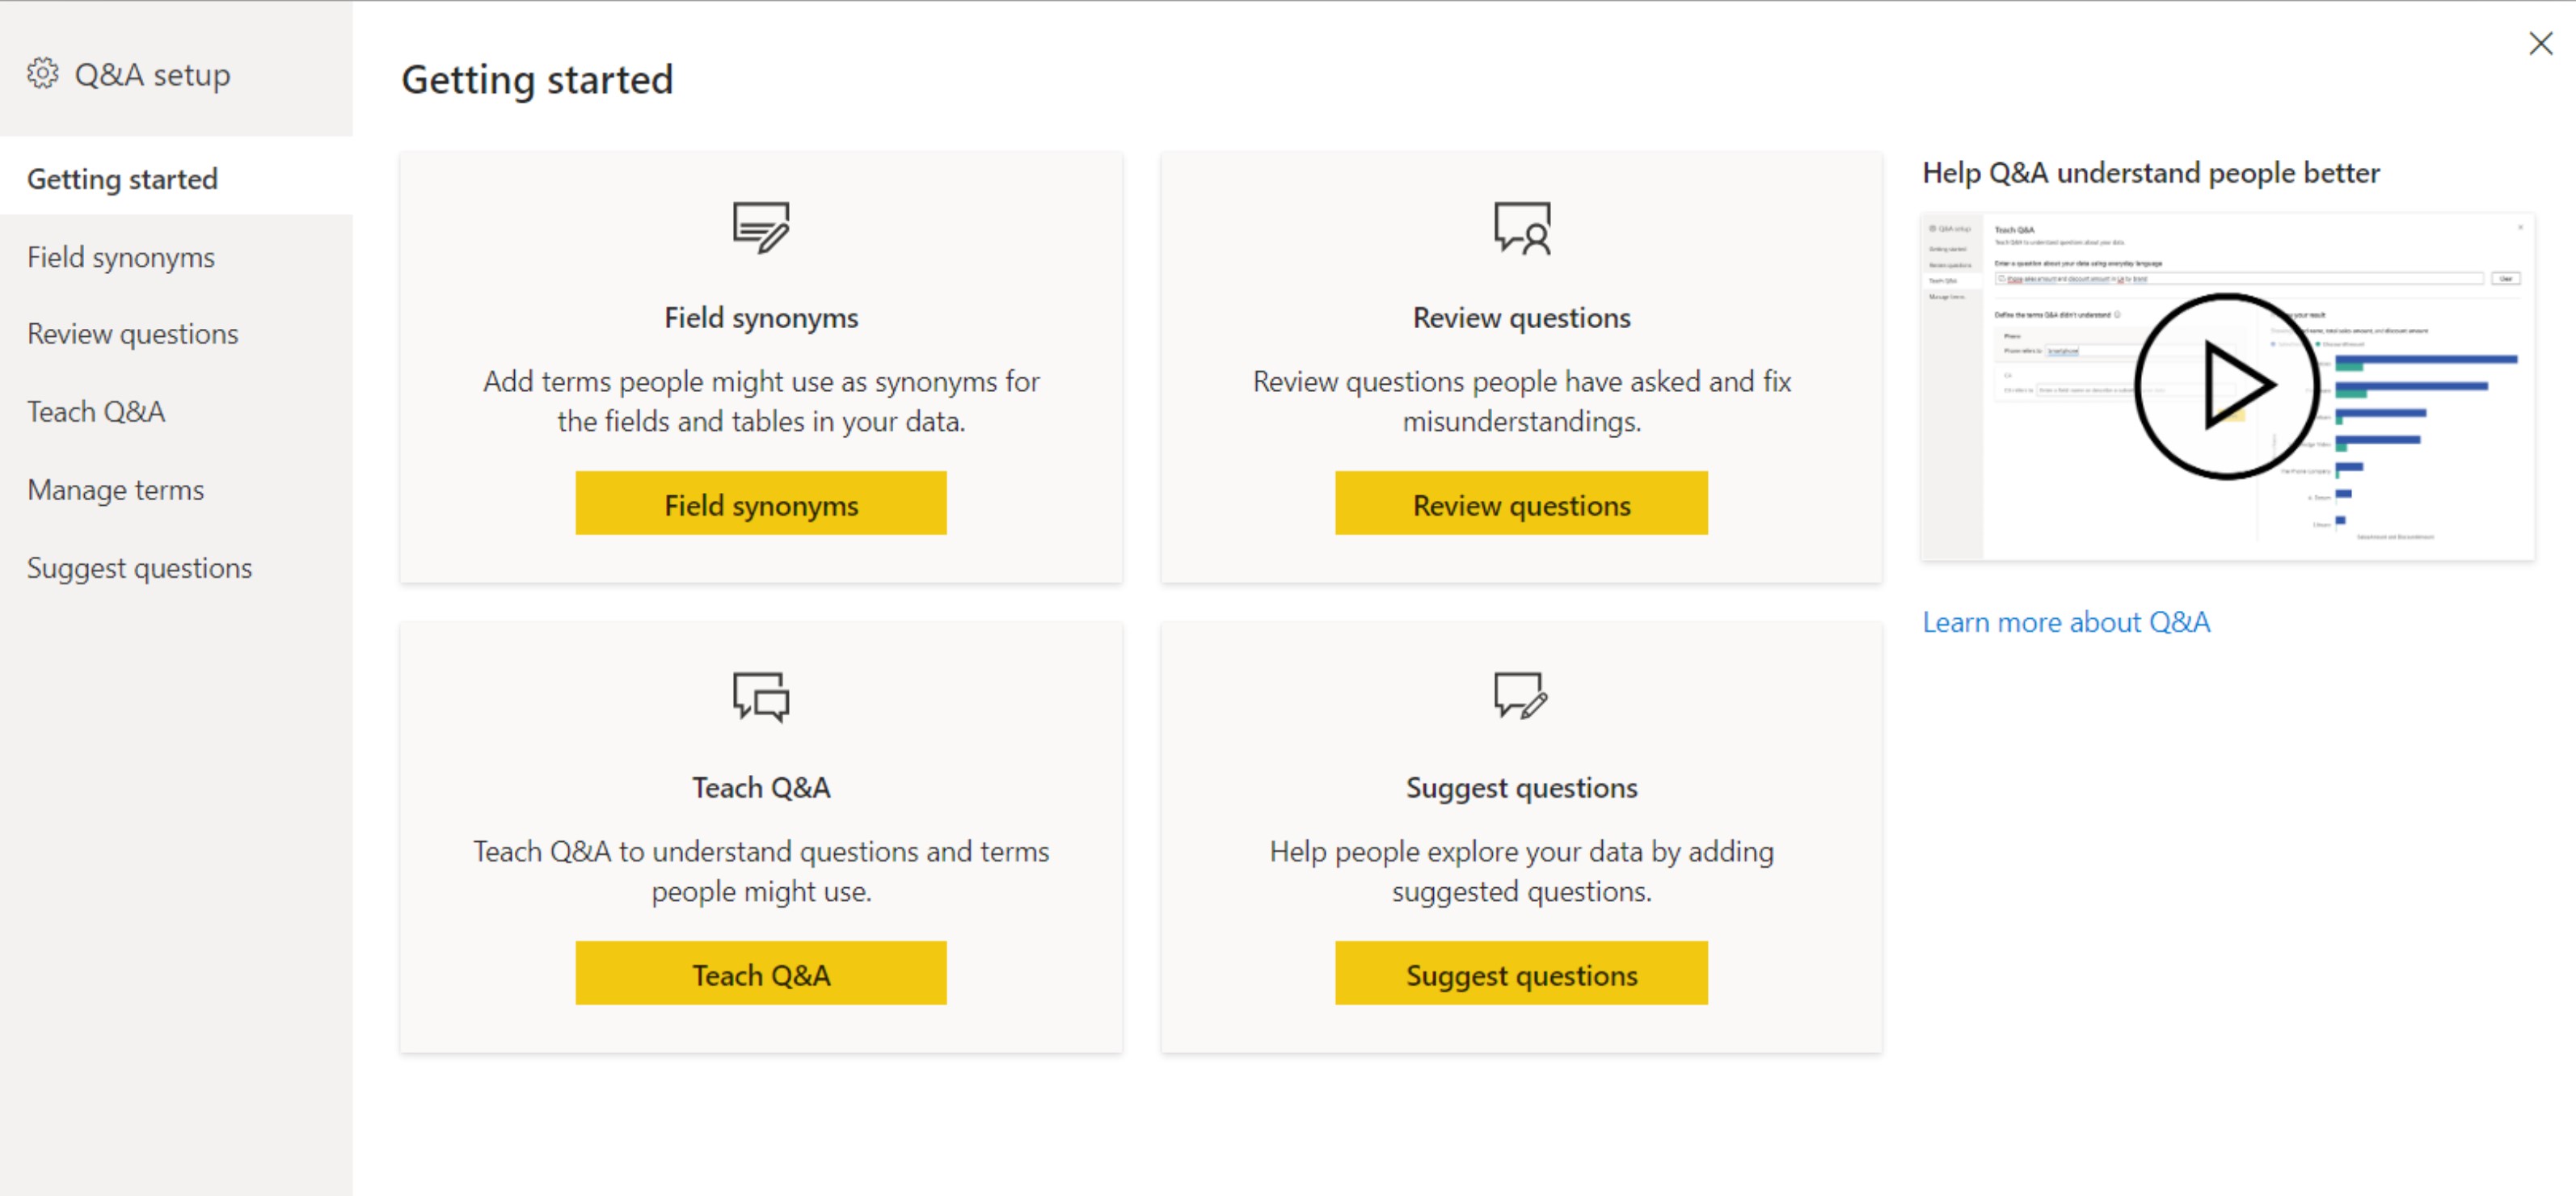
Make sure you set yourself up for the best possible user experience by taking the time to set up and personalise your Q&A properly. Here’s a bit about each one:
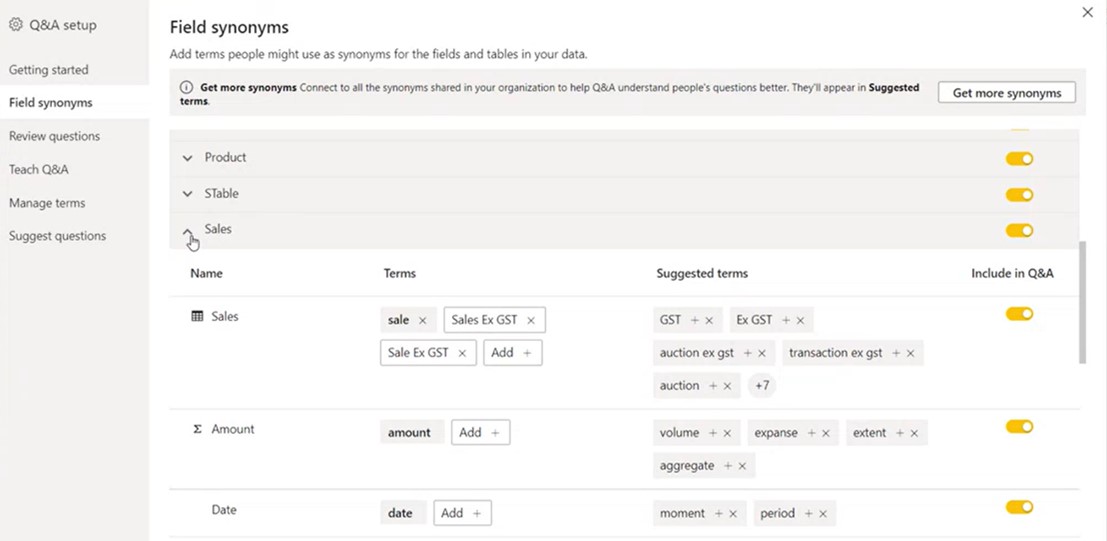
Add field synonyms
You can improve your NLP experience by adding different terms and synonyms to Power BI’s language. This makes it easier for users to find what they want in their own words.
• Add terms that your team might use to ask questions.
• You can add field synonyms for any of the categories in Power BI.
Teach Power BI common questions to understand
For faster results, you can train the search engine to recognise and understand questions and terminology you know your team will use.
• Type in questions you know will commonly be asked.
• These will later be shown as prompts to users before they start typing in their questions.
Example:
• “What were this year’s sales and last year’s sales?”
• “What was this year’s revenue and last year’s revenue?”
• “What was our annual income this year compared to last year?”
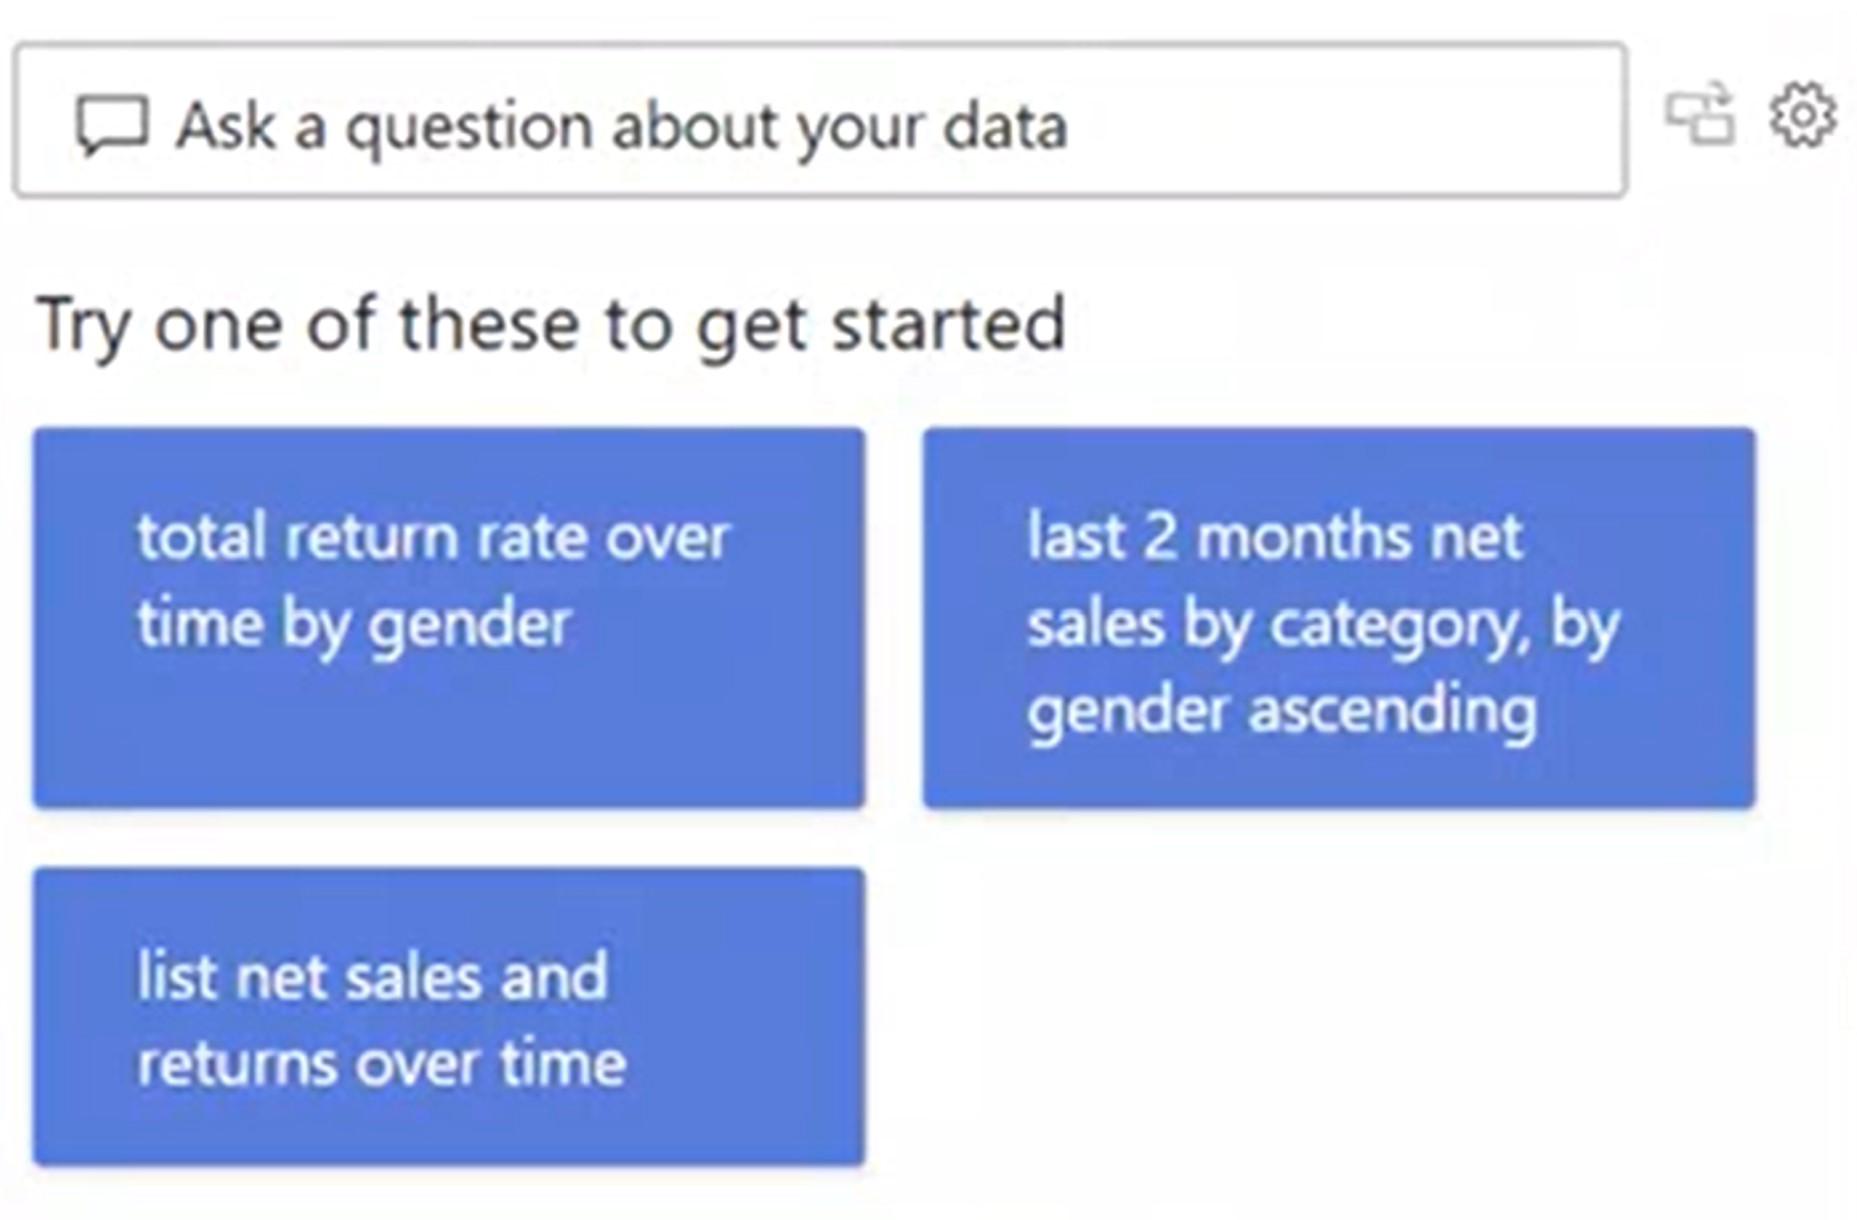
Suggest question prompts
Help the search engine form paths and relevant suggestions by preloading question prompts. The more questions you include, the more feedback your team will get as they type.
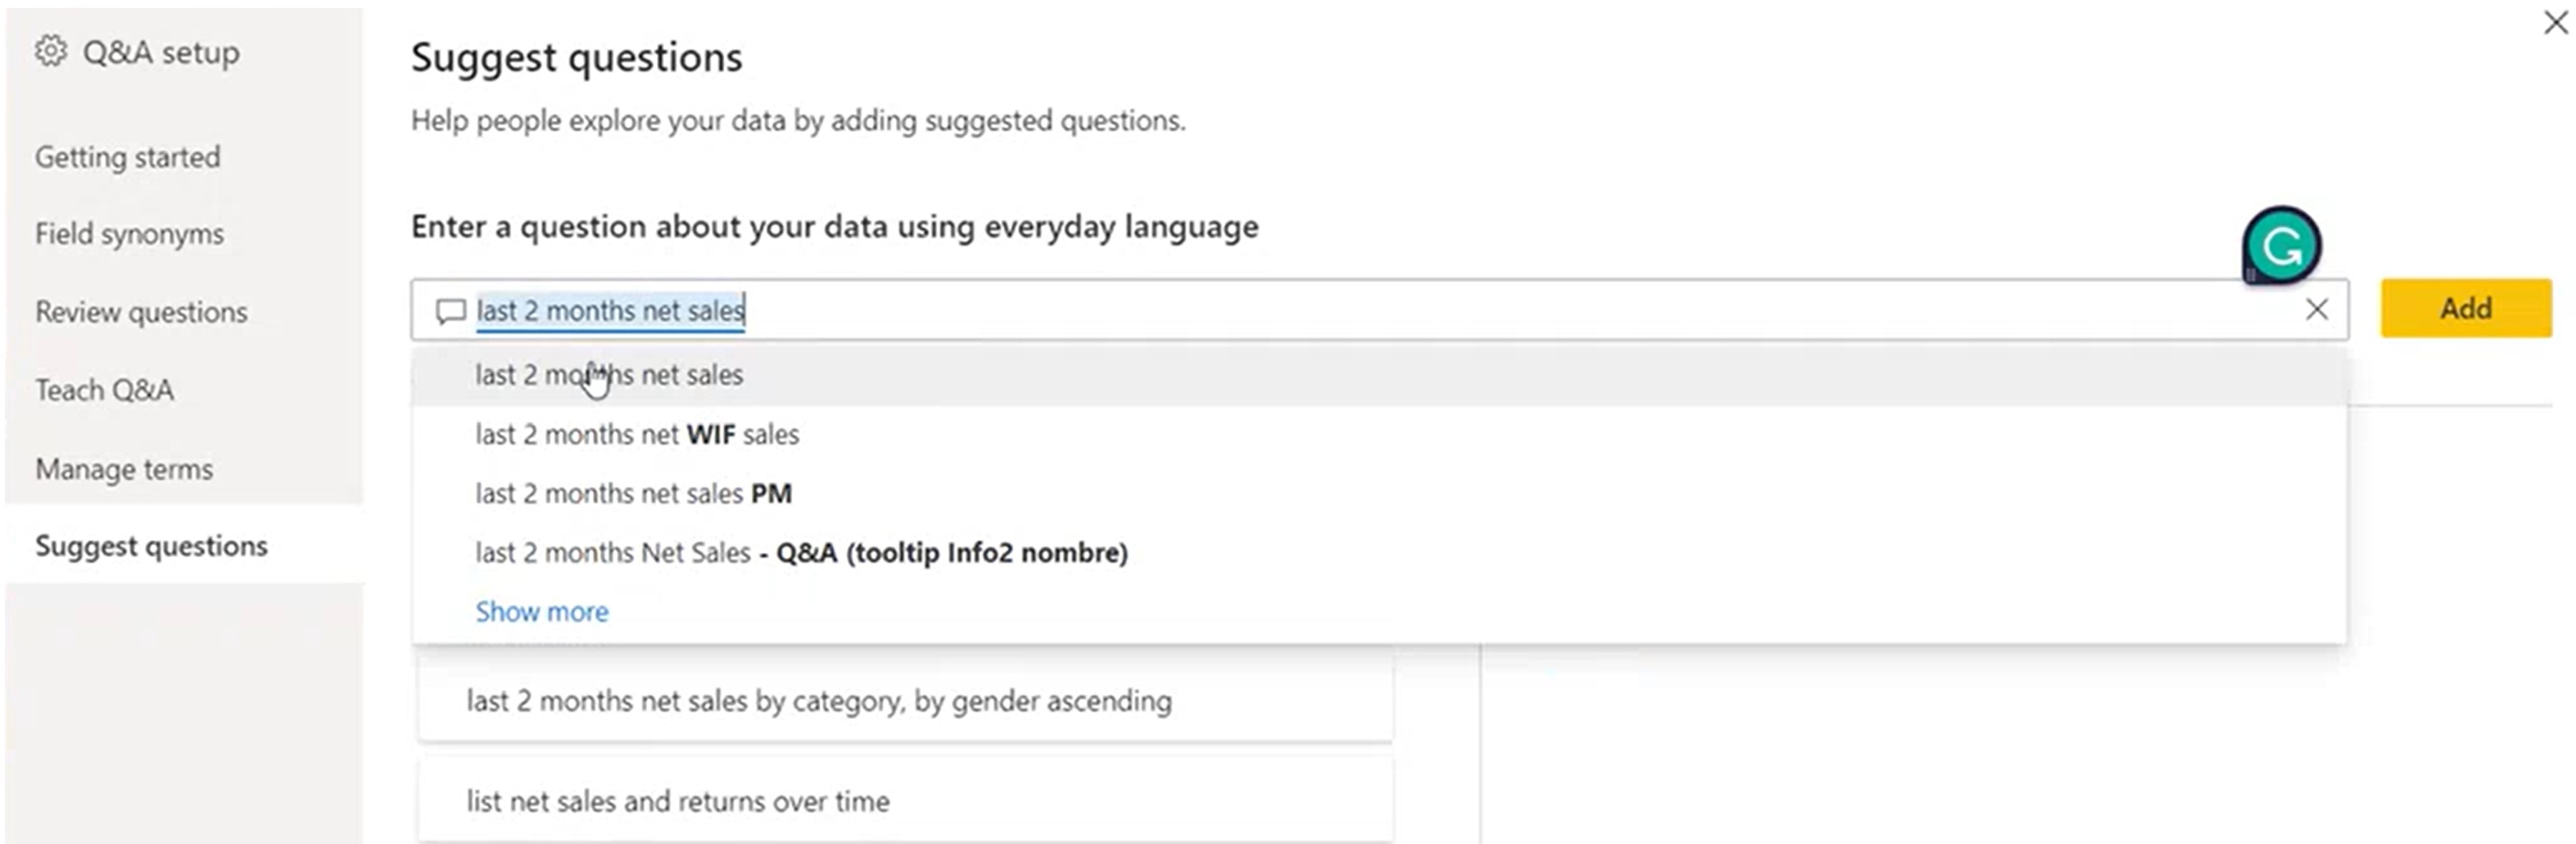
The questions you suggest will then show as prompts like this:
Review questions frequently when getting started
We suggest you take some time to review questions from your team to catch misunderstandings or new terminology that the search engine isn’t familiar with.
• Remove confusion and increase speed for searches.
Tip two: take advantage of the tools
There are some super useful tools within Power BI Q&A that, when used correctly, can level up your data game.
Key influencers visual tool
The key influencers visual tool helps you understand what factors are influencing your metrics and prioritises them neatly.
Example: “What influences income level to be: High”
Meaning: What influences generate high income for your business?
Power BI looks at what is causing things to happen and then gives you the information about it in a clear and easy-to-understand way.

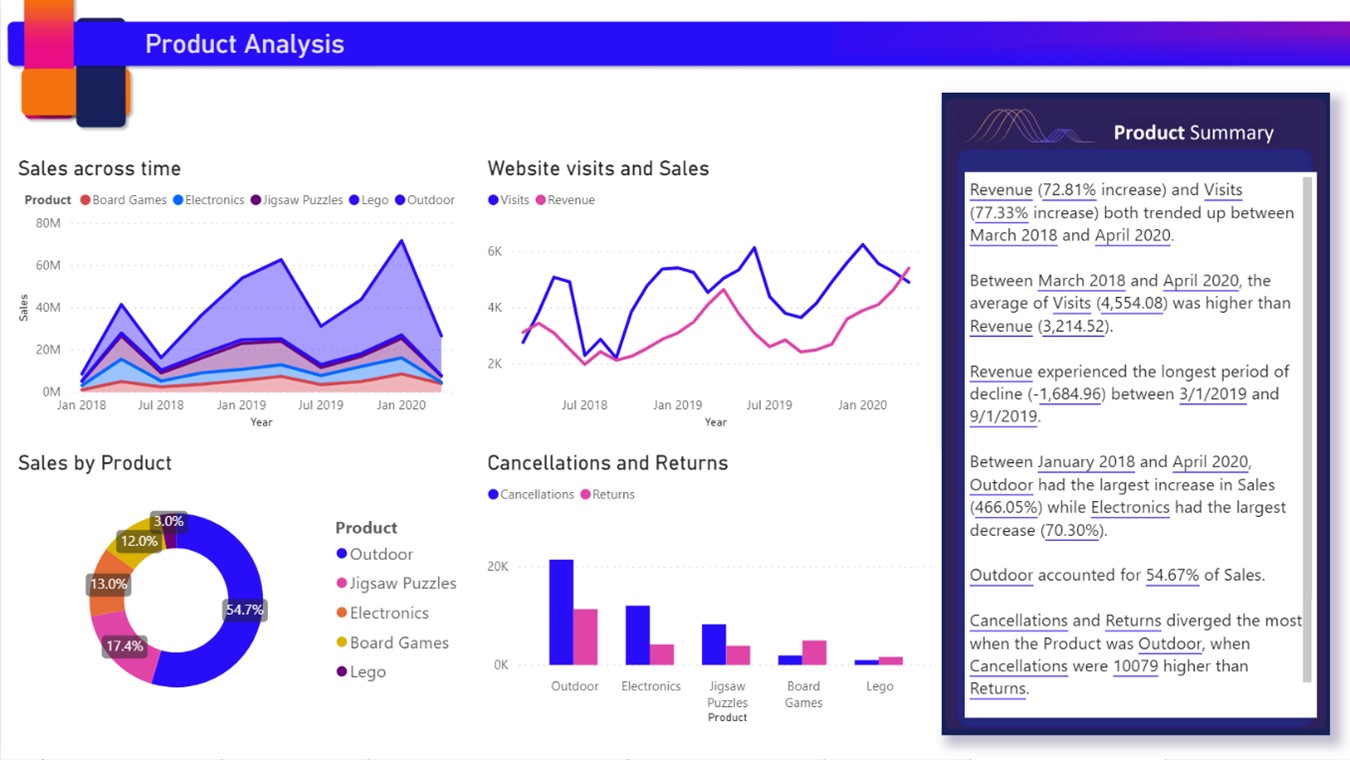
Smart narrative visual tool
The smart narrative visual tool turns your visual data into written information. It breaks down what you’re looking at and points out why things are how they are. It breaks down numbers and percentages in regions and changes according to what you’re looking at – updating the report in real time with information based on your chosen data.
Smart narrative is an out-of-the-box visual available in Power BI for free. You can try it without buying any extra add-ons.
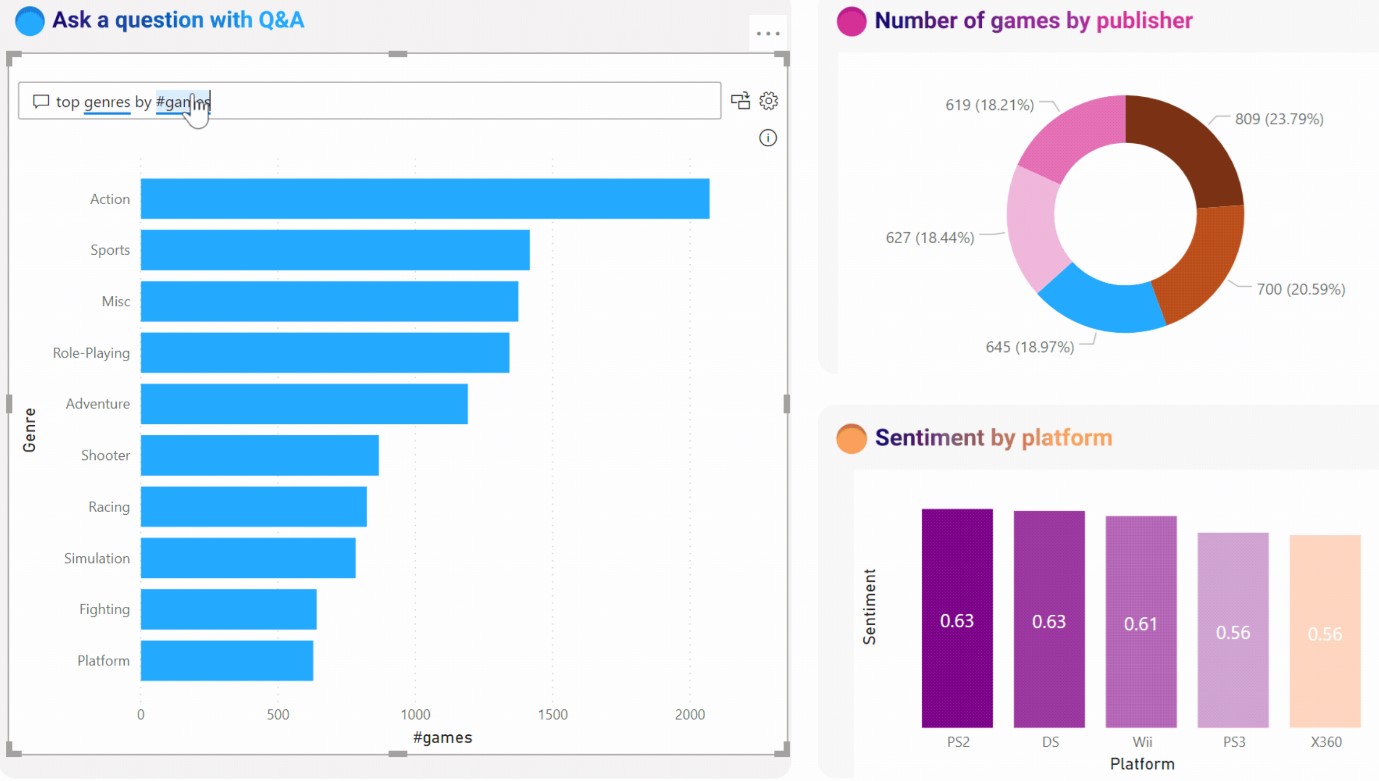
Tip three: add your Q&A visual to a report
To add the Q&A visual to a report, select the Q&A icon or select the Q&A visual in the Visualisation Pane. You can also double-click anywhere on the report canvas to automatically insert the Q&A visual. If you want a different colour way, you can change the colours on your visual to match your company.
Now you can try these tips n’ tricks to get the most out of your Power BI Q&A experience.
For personalised help in Power BI, speak to our team of specialists.
Related Posts

July 5, 2021
Small Multiples in Power BI: making business reports easier to understand
Small multiples, a new feature in Power BI, was released for public preview in December 2020. It tackles the cluttered chart problem by allowing you to split a visual into multiple versions of itself. You can then present these visuals side-by-side and instantly make them easier to interpret.

September 22, 2021
DataOps, Power BI governance and modern data warehouses – summary from Thetalytics 2021
Thetalytics: Data & analytics trends, opportunities & challenges is our annual data and insights focused event, designed for businesses of all shapes and sizes, tackling business and technical considerations around the hot topics in the data and insights world.