


.avif)


.png)
February 26, 2024
Tips & Tricks for Generating Reports With Copilot for Power BI
There are just a few things to remember when getting started with Copilot for Power BI. Our Principal Consultant in Data and Insights and Microsoft MVP, Soheil Bakhshi, has listed some of his tips & tricks for you below.
First, a word on Fabric, Copilot and licensing
As we all know, things are constantly evolving, so it’s worth checking the latest information about Copilot/Fabric/licensing. Alternatively, get in touch, and we can steer you in the right direction.
What you should know about Microsoft Fabric:
- Power BI is a component of Microsoft’s complete analytics platform, Microsoft Fabric (which used to be called Power BI service). Therefore, you may also hear it called ‘Power BI in Microsoft Fabric’.
- Power BI can be accessed regardless of your data platform tenant.
- The points above apply to all Power BI licenses – from free to pro to premium.


What you should know about Copilot/licensing:
- Copilot for Power BI is now available in NZ.
- Your workspace must be running on F64 or Premium capacity to access Copilot for Power BI. Ultimately, it means Copilot for Power BI is (currently) better suited to larger organisations. This may change in future.
- Your tenant admin needs to have enabled it for the tenant.
- Copilot is not available on Fabric trial.
- We have specialists who can help guide you around licensing.
[For more info, here’s Microsoft’s overview]
Old data models? Time for a spring clean
Your Copilot generated reports will reflect incorrect findings if your data model is built incorrectly. Take some time to set up the foundations by checking for any errors in your current data model that may affect your Copilot. Fixing these issues will help you leap over hurdles down the track and report faster than ever. If you need some help with this, our Data & Insights team will gladly help.
Match your data relationships correctly
Missing or incorrect relationships in Copilot's semantic data model will lead to inaccurate data visualisation.
For example:
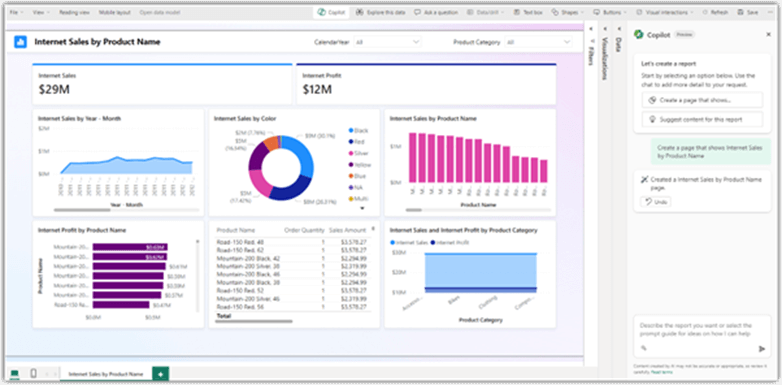
On the chart in the bottom right of the report, there is a flatline for Internet Sales and Internet Profit by Product Category.
This flatline indicates a potential missing relationship between the Product Category and the Internet Sales tables.
You can fix the issue by mending the relationship between the two tables, shown below:
You can fix the issue by mending the relationship between the two tables, shown below:
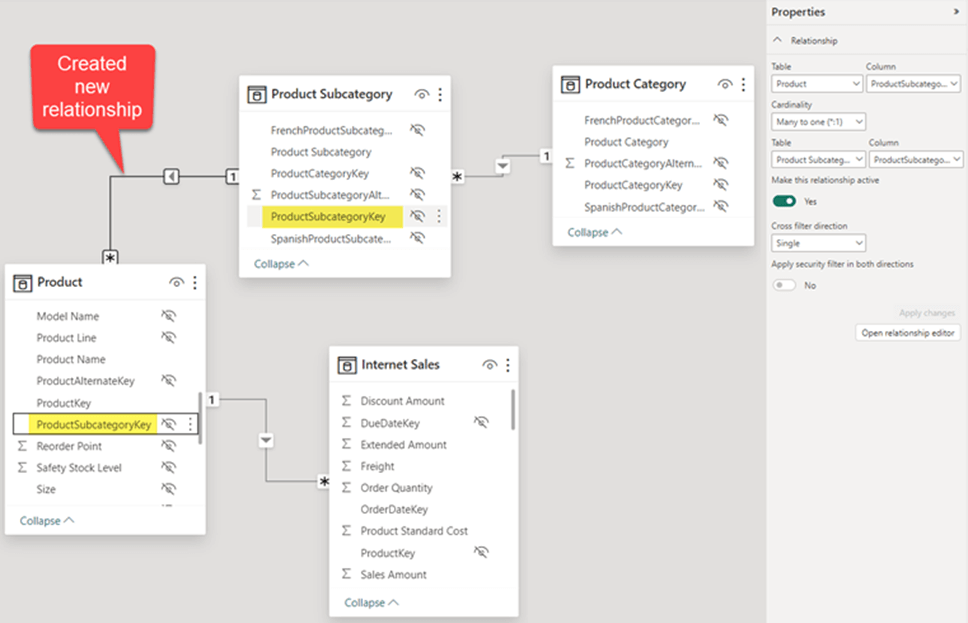
You can fix the issue by mending the relationship between the two tables, shown below:
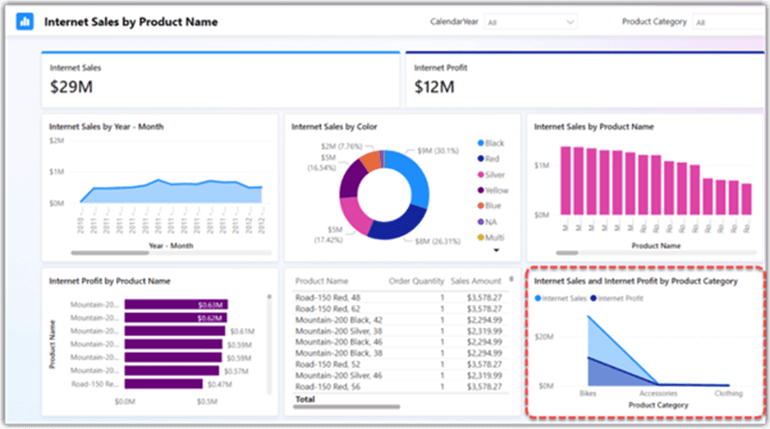
Once fixed, the new report should look like this!
User-friendly names
Use more user-friendly names in the data model. It makes life easier for you and your Copilot.
For example:
Total Sales as a measure name would be better than TotalSales. This is because Copilot can easily identify that ‘Total Sales’ is two words, rather than trying to split the word ‘TotalSales’.
[Tip: No one likes Col1 or Tbl1 names for any objects, especially Copilot…]
Create hierarchies
A hierarchy indicates a particular arrangement of your data. For example:
Product Category ➡️ Product Subcategory ➡️ Product Name
To help Copilot quickly identify data groups, you should create hierarchies in tables by grouping them from high to low levels.
This grouping is also beneficial when doing drill-down activities*.
*drill-down activities allow users to navigate from a higher-level summary of data to a more detailed view of the data with one click.
Pay attention to data types
Defining correct data types for measures and columns in the data model helps Copilot to generate better reports.
For example:
Using Date instead of Text data type helps Copilot understand it's dealing with date values instead of text.
Simple prompts work best
In my experience with the report generation capability of Copilot for Power BI, it performs best when using simpler prompts with minimal conditions.
For example:
Simple prompt: Create a page that shows Sales by Product ✅
Long prompt: Create a page that shows Sales by Product where Product Category is "Accessories" and Calendar Date is 2012
While the long prompt will still generate a report, it will be less accurate due to the added complexity of the prompt.
Need more help?
If you need me or someone from our team to optimise your data model for a better Copilot for Power BI experience, get in touch.
Related Posts

July 18, 2023
Power BI Governance: What Organisations Need to Know
As more organisations adopt Power BI, it becomes essential to ensure appropriate governance processes, policies, and rules are in place. This blog post explains Power BI governance and why business owners need to be conscious of it.

April 12, 2023
The Natural Language Tools in Power BI
Since the release of ChatGPT, attention has turned to ‘natural language queries’ to get the answers you need. But did you know Power BI has a couple of tools available to help you with your data?