September 22, 2016
What is R?
Many business intelligence and big data tools provide integration with R, a tool first developed here in NZ 20 years ago. But what is R, how does it relate to data science and how can we best use it?
What is R?
R is a programming language and development environment specially designed for doing statistical computing and graphics. It is free and open source. R is built on ‘S’ programming language and was created right here in New Zealand by Ross Ihaka and Robert Gentleman, in 1993, at the University of Auckland. It gets its name from their names. The project is currently developed by R Core Team.
The Comprehensive R Archive Network (CRAN) is a collection of sites which store identical copies of information related to R distribution, packages, extensions, documentation and binaries. These binaries are available for various operating systems (Linux, Mac OS Classic, Mac OS X and Microsoft Windows). Anybody can contribute to CRAN if the contribution meets the CRAN repository policy.
Statistical analysis and visualisation are integral to data science. R is particularly popular for its data munging and wrangling capabilities - to reshape data into a suitable form for analysis. This is usually done before any serious data analysis. R is enriched with many statistical analysis techniques. Name any statistical data technique and chances are it will be available in R.
R has a vast and diverse package ecosystem. There are around 9,000 packages available from multiple repositories, specialising in topics like econometrics, data mining, machine learning, spatial analysis and bioinformatics.
Visualisation with R
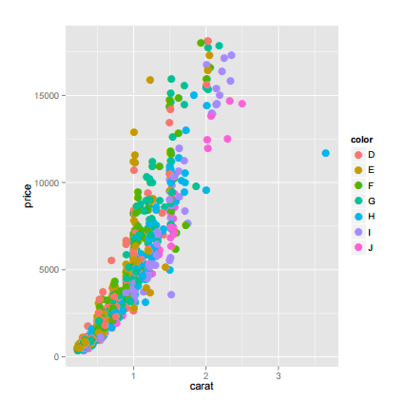
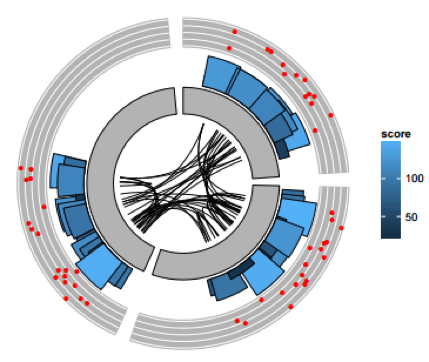
R is recognised for its beautiful visualisation capabilities. Below are some R visualisations built using lattice, ggplot2 and ggbio packages.
Scatter plot
Circular
Venn
Mirrored Bar Plots
Heat map
Density plot
Many business intelligence and tools, including Tableau, Microsoft Power BI, and MicroStrategy now provide connectors to R for augmented analytical and visualisation capabilities.
R and machine learning
R and machine learning go together very well. Because R has strong ties to academia, any new research is usually implemented as an R package.
See our related post: Creating smart reports and applications with machine learning and R.
Some business intelligence and big data tools that integrate with R
Some of the most useful R packages
Following is a brief overview of R packages related to data munging, data analysis and machine learning tasks.
listviewer: Data display, and data wrangling
sqldf: Data wrangling, and data analysis
quantmod: Data import, data visualization, and data analysis
dplyr: Data wrangling, and data analysis
ggplot2: Data visualization
dygraphs: Data visualization
googleVis: Data visualization
plotly: Data visualization
e1071: Latent class analysis, short time Fourier transform, fuzzy clustering, support vector machines etc.
caret: Classification And Regression Training
gbm: Generalized Boosted Regression Models
RWeka: R/Weka interface.
nnet: Feed-forward Neural Networks and Multinomial Log-Linear Models.
randomForest : Random forests for classification and regression
R plays well with many other tools, importing data, for example, from CSV, SAS, and SPSS, or directly from Microsoft Excel, Microsoft Access, Oracle, MySQL, and SQLite. It can also produce graphical output in PDF, JPG, PNG, and SVG formats, and table output for LATEX and HTML.
Benefits and limitations of R
Although it has many benefits R is not perfect!
As R was built on a language created in 1960s, the old design poses some challenges when working with very large data sets. Memory management, speed and efficiency are the main challenges.
Pros
- Most comprehensive set of packages
- Cutting edge technology appears first in R
- Outstanding graphics capabilities
- Open source and open validation
- No licence restrictions
- Over 9000 packages
Cons
- Steep learning curve
- Sometimes patchy documentation, hard to understand by non-statistician
- Quality of some packages is less than perfect
- Memory management issues
To conclude...
Despite a few limitations, R is great for doing data science. It is great for visuals, includes many cutting edge and up to date packages, and is widely connectable to business intelligence and big data tools. Give it a go!
Useful resources
- Go to R-project to get started with R
- Quick-R is a really good resource for a brief introduction to R programming language
- R-bloggers is good for knowing what is happening in the R world


.jpg)

-p-500.png)
%20(1)-p-500.png)
%20(700%20%C3%97%20500%20px)%20(2)-p-500.png)


%20(1)-p-500.png)


